I’ve been studying and analyzing financial statements going back to my days at KPMG in St. Louis.
But I’d have to say I started doing it for fun (yes, fun) when I would receive hundreds of annual reports mailed to my home, thanks in part to my membership with the National Association of Investors Corporation. That would have been in the early 1990s when I only had access to Quattro Pro, the Lotus-like product that ran on the 286 processors (man, I’m old).
More than 20 years later, I still love reading and studying financial statements. Give me 60 months of financial data, and I can tell you a lot about a company in less than 5 minutes. I can even pretty much sum up the personality of the CEO and the underlying culture of the organization.
And for the first time ever, I’m going to give you a brief glimpse of what I do when I obtain financial data from a brand new client. So let’s dive in.
Sales
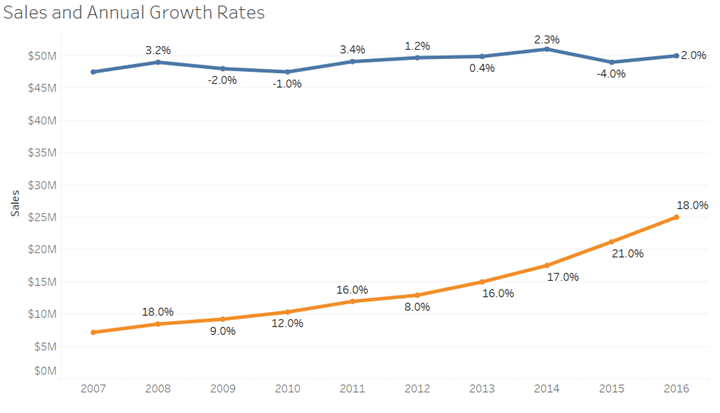
In the screenshots below, we’ll be looking at two companies–Growing Big (in orange) is a $25 million organization whereas Boring Company (in blue) is twice that level in sales.
Normally, I’m only looking at the business I’m taking on as a client, but I want to make some important points about good vs. bad numbers, and showing two companies allows me to do this.
Accordingly, let’s start with sales. The very first thing I want to know is if sales are dropping, growing, or just moving sideways as such:
While Growing Big is half the size of Boring Company, whose growth rates do you like the best?
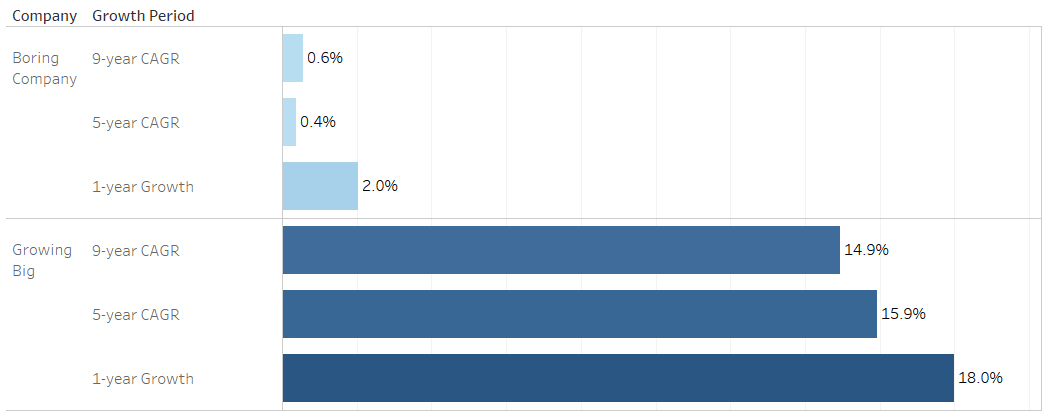
And while we’re at it, let’s look at some compound annual growth rates:
I should have mentioned, my new client is Growing Big, and while their sales growth rates look great, we’re far from finished.
What if this high-growth company is hemorrhaging cash? Or what if the balance sheet is upside down? Don’t worry, we’ll arrive at those answers pretty quickly.
Revenue Per FTE
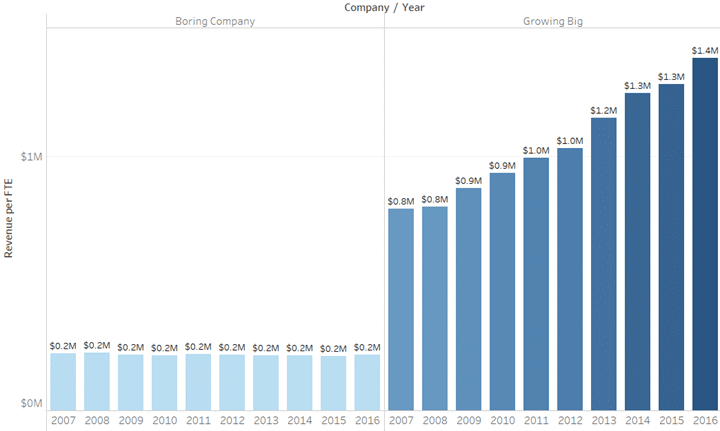
Financial analysts are not supposed to have favorite ratios. We can’t since we possess holistic mindsets. Still, I’m a major fan of Revenue Per FTE, especially if I can see the trend.
This simple metric tells me so much about the CEO I’m taking on as a client. I can easily gauge their business maturity especially if the number is moving in a positive direction.
First, Revenue Per FTE is a slow-moving metric. It’s like watching ketchup being poured from a bottle. By laws of financial gravitational force, it’s impossible to budge. Then again, it depends on just how operationally and technologically savvy the CEO is.
Let’s take a look:
Not only is Growing Big growing in sales, they have something up their sleeves with respect to a rising Revenue Per FTE. I mean, “Geesh, $1.4 million?” Okay, so I made up the numbers. But the performance is still impressive.
In case you were wondering, Apple’s is around $2 million per FTE and Google’s is $1.2 million (thereabouts).
Amazon? Not quite $.5 million.
And Boring Company’s? Well, pretty boring at $.2 million and moving sideways. I think it’s fair to say there’s more technological advancement at Growing Big–maybe. I’ll follow-up with the client later to inquire about customer satisfaction levels. This will ensure we’re not being stingy on adding staff while risking deteriorating service levels with customers.
Gross Margins
Again, I’m only looking at the company I’m analyzing. I’m not doing any type of benchmarking. Accordingly, I’m looking at whether the numbers are going up or down. Trends are important.
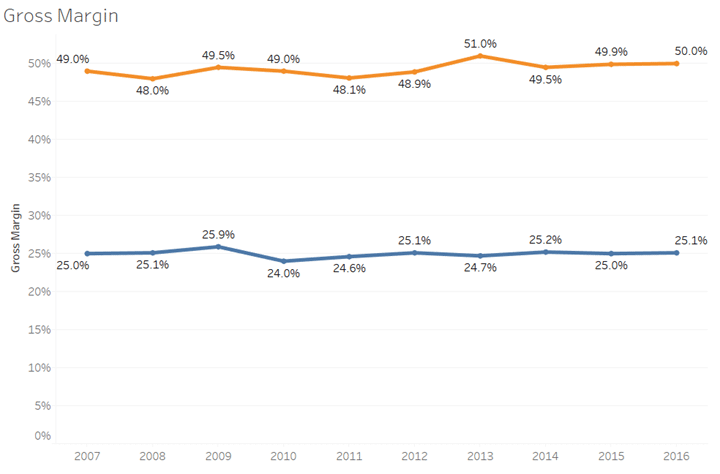
And that leads us to gross margin. In my opinion, it’s the most critical margin on the income statement, yet the hardest to manage and even maintain during times of turbulent economic headwinds. If this number cannot be constantly tamed, then profit margins go out the window.
Here’s what we have to look at:
So we can clearly see there’s no significant variation from period to period.
Margins driven by commodities with mismatches in supply and demand can easily wreak havoc on the bottom line. My biggest concern with Boring Company is that there’s very little room for error with those smallish gross margins.
When there’s an obvious and natural ceiling on an industry’s gross margin, that means CEOs have to watch selling, general and administrative costs like a hawk. Again, there is little room for error. Cost containment and continuous improvement activities are tantamount.
Profit Margin
Every single business I’ve worked with is either a partnership (LLC) or an s-corporation (and most are LLCs too). And that means all the bottom line numbers are before taxes. So, the numbers below do not include payments to Uncle Sam:
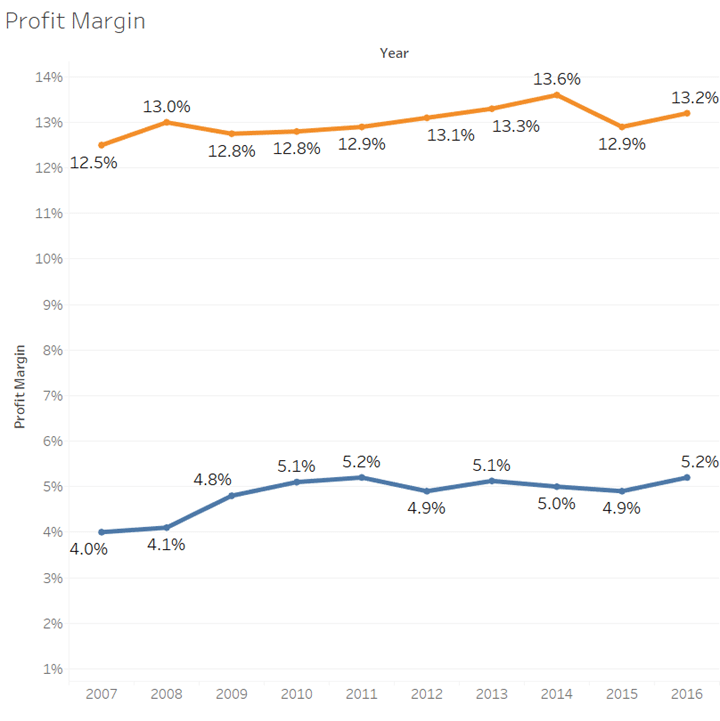
As with other numbers we’ve looked at, I’m looking for strange movements or crazy gyrations. In both cases, there is minimal variation.
I have more to say about the bottom line, but that will be within the context of several key numbers on the balance sheet I’ll address later.
Before we move on, see the natural progression of my analysis? I’m starting with the P&L. I started at the top and then moved my way downward.
This is a macro-level analysis. So we’re not getting into the weeds. Remember, these are the numbers I focus on first.
So let’s move on to the balance sheet.
Return on Equity (ROE)
I debated on whether to include ROE. Since I look at it (and very quickly), I thought I’d better do so.
Why the hesitation? Tax accountants are notorious for butchering balance sheets. That’s fine for tax purposes, but not for GAAP reporting (GAAP with small letters).
Most small business owners make their internal financials match the tax numbers at the insistence of the tax accountants. That means retained earnings are generally understated due to accelerated depreciation charges. When that happens, ROE can yield some silly-high results.
Also, owners who lack financial sophistication and who think it’s their bank’s sole purpose to fund business growth at a whim tend to pull out too much cash from their annual earnings. This drives down equity and accordingly yields a crazy-high ROE as well.
Call me a fool, but I still look at these numbers:
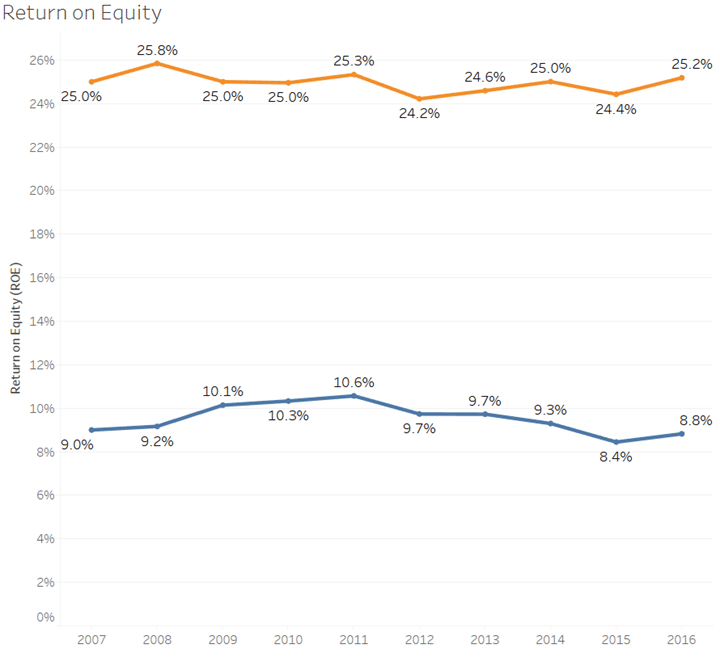
Surprise, surprise. Not much year-over-year change. But what if Growing Big’s ROE was rising rapidly?
Then I’d be looking for some financial engineering. In those cases, I care the most about an excessive growth rate in debt which can drive an ROE increase.
And so that’s the next number I look at. Accordingly, I look at debt to equity. In the matrix below, we see no noticeable growth:
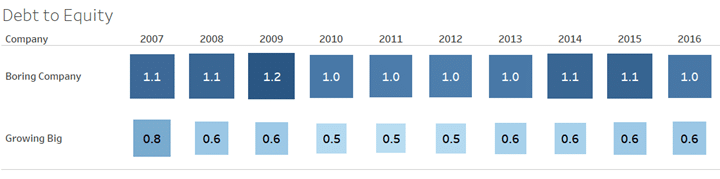
So let’s put the two pieces together. In reality, the image below is how I look at both numbers in the same view. I’ve filtered my data on Growing Big, and the image reveals our ever-so-slight increase in ROE is not being driven by debt growth. When that happens, that means cash, more than likely, or other assets are growing.
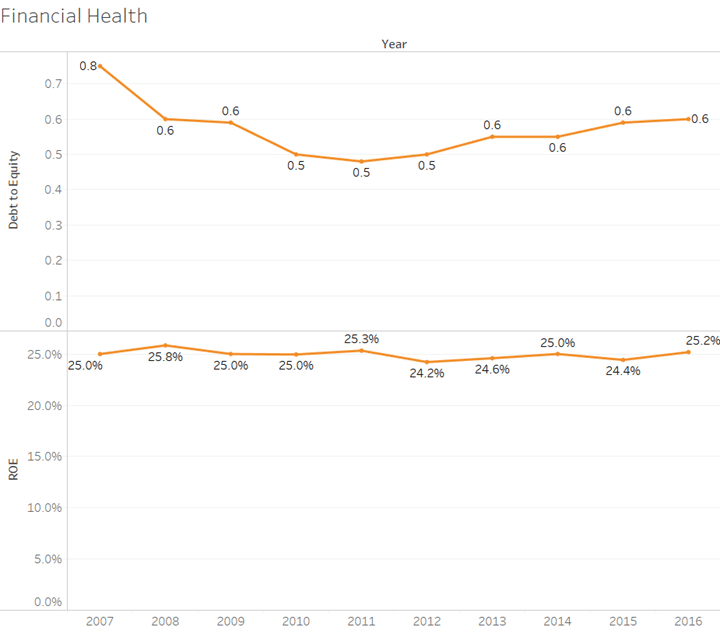
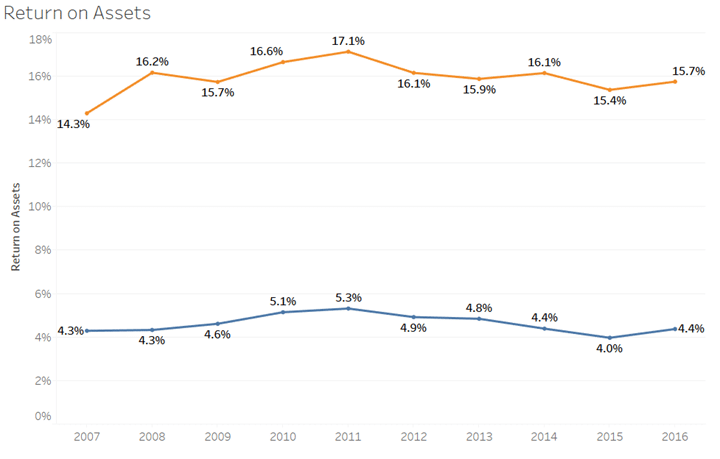
Return on Assets
Speaking of assets, let’s start seeing how each ownership manages it precious resources. I’ll state here that I typically don’t spend much time on working capital in this high-level analysis.
Return on assets will always be lower than ROE. But Boring Company’s numbers are way, way too small. We’ll need to investigate later.
I’m placing my money on excess and/or dead inventory. Remember the stodgy Revenue per FTE for this company? It’s not poor performance on capital expenditures. Well, that’s my theory, but one that needs to be studied.
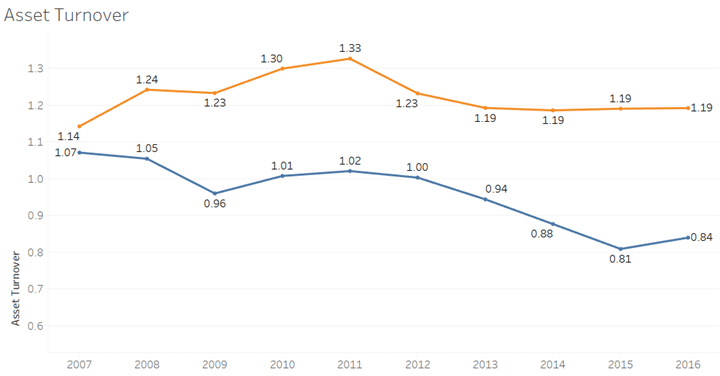
Asset Turnover
Another way to measure asset performance is to look at the Asset Turnover trend.
Brett Daffron of Commerce Bank (Kansas City) is one of the most financially-savvy bankers I’ve ever worked with, and he loves this number.
Growing Big finished the year at 1.19. And what does that mean?
Brett will tell you that for every dollar that Growing Big has in assets, it’s generating $1.19 in sales. And I can certainly tell you that’s a poor number:
To put this simple ratio in perspective, Wal-Mart’s recent Asset Turnover was more than 2.0. While there’s much to like about Growing Big, perhaps we’ve found their biggest weakness–asset management (I prefer the term asset stewardship).
Cash, Cash, Cash
We haven’t hit cash yet. And it’s part of my high-level analysis. Plus, I keep it super simple.
Here’s the first thing I look at:
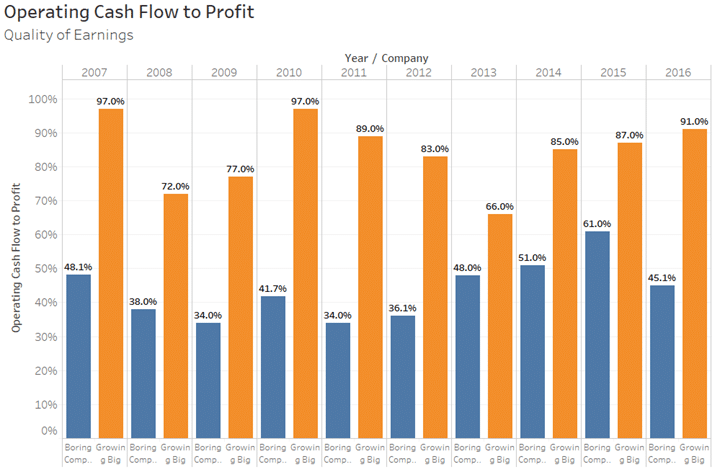
I cannot begin to tell you how important these numbers are–Operating Cash Flow to Profit.
So what are we measuring? We’re comparing operating cash flow to earnings/profits before taxes. In a cash business like Taco Bell or Pizza Hut, expect operating cash flow to profits to be around 100% always. That’s because inventory rarely moves and there is no AR (accounts receivable). In short, working capital just doesn’t move that much.
In a small business where owners struggle with working capital management, expect to see wild fluctuations from period to period.
That even happened to Growing Big when they dropped to 66% a few years earlier. In recent years, they have trended favorably from 85% to 91%.
Boring Company? Ouch. We need to dive into the cash flow statements to see what’s happening.
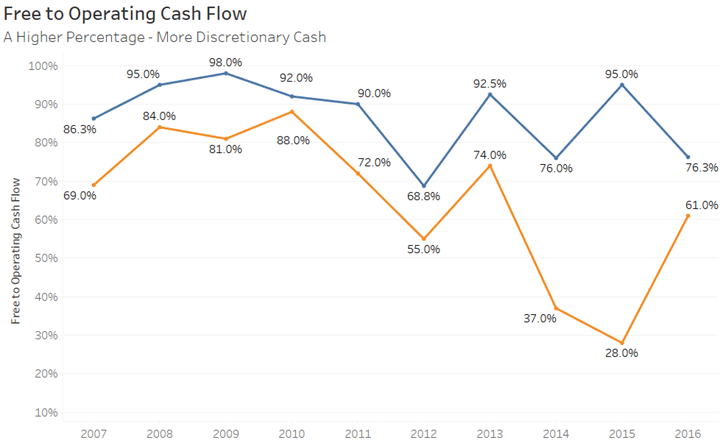
Free Cash Flow Analysis
While I’m on cash flow, I like to scan free cash flow too.
Free cash flow is defined as operating cash flow less capital expenditures. But I much prefer the Mark Gandy definition of free cash flow. Instead of subtracting all CapEx from operating cash flow, I only like to subtract maintenance CapEx which means I’m excluding large, infrequent investments in a new plant, warehouse, or something similar.
So I like to look at Free Cash Flow to Operating Cash Flow expressed as a percentage. If we have a high percentage, that means more discretionary cash flow for the owners. They can either pay down debt or pull it out of the company.
Here are the results for each entity:
Interestingly, Boring Company’s Operating Cash Flow is not being used very much to fund capital expenditures. Is that why Revenue per FTE is depressed? We’ll need to find out. My theory is that minimal CapEx means little if any technological creativity or improvement.
Notice the variation of Growing Big’s ratio. I will be curious to find out the large-ticket items they have been spending money on.
Retained Earnings
If cash flow is the lifeblood of any company, then retained earnings has to be the center of gravity of any growing business. That’s because retained earnings is the fuel for future growth. True, debt plays a role. But mature and growth-minded CEOs understand how critical retained earnings are now and down the road to not just grow but to sustain a business over the long term.
So let’s take a look at the three rows or levels of detail I study in the picture below:
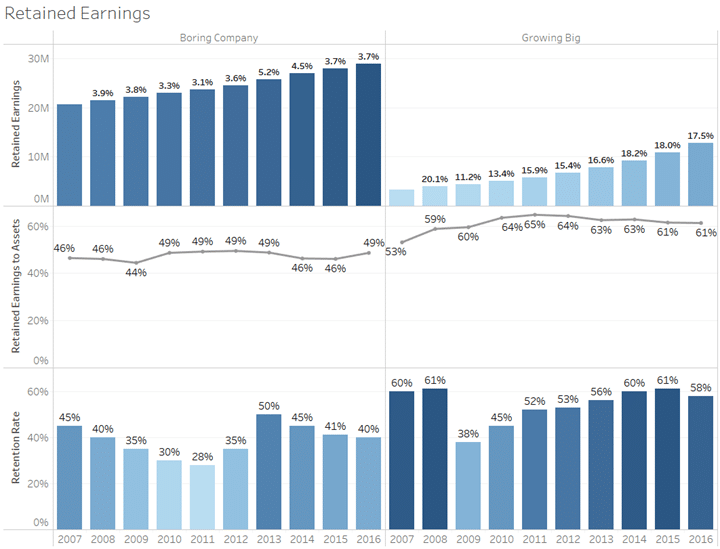
In the first row, I’m just looking for one thing. Is the trend upward, downward, or sideways? Movement in Retained Earnings is a function of profits and retention of such profits.
And that leads to the third row (I skipped the second row for now). The retention rate is another one of those favorite metrics I take very seriously. Most small businesses I encounter pull way too much out their businesses relying heavily on bank debt to solve growth issues and poor stewardship of working capital.
I’m not looking for a certain retention rate. If we’re growing, I just want a nice fudge factor where the retention rate exceeds the company’s growth rate (in terms of sales).
I skipped a row–Retained Earnings to Assets. I want to know if we’re dropping. And if so, I have enough data to understand why. What I hope to see in any company is consistency with this number. If not, fasten up, the financial ride is going to be bumpy.
And That’s a Wrap For Now
So there you have it. Nothing fancy. Just the basics.
Yet, I can quickly surmise the health and the direction of a company in just a few minutes once I have the data.
I stated earlier this is a holistic approach. Well, yes and no.
I don’t know much about the company’s strategic (and off-balance sheet) assets nor the affinity it has with its customer base. Even the numbers cannot tell you about the employee morale. Is the business highly dependent on a control-oriented CEO? Are systems and processes sound? Does the company have a small monopoly or swimming with sharks in a commodity-driven sandbox?
There’s still more to learn, but this is just a starting point. And it’s a good one according to every client who signs me up as their new CFO.
See The Full Set of Visuals
Here’s the link to my Tableau Public site with all the images included in the article above.
Photo Credit: Joshua Earle