A few days ago, I received an e-mail from a growing online dashboard provider, and the topic was monitoring your current ratio. What boggled my mind was that their success indicators ranged from 1.5 to 3. There were no additional comments about how certain results could be misleading.
I serve some amazing clients who have a current ratio around 1 to 1.25. Our cash positions are sound. We manage the lines of credit with great care and responsibility.
Our bankers are not immune from fixating on the current ratio and get worried when they see it drop under 1.5. Once I show them our other indicators and the rolling cash flow forecasts, all is well–that is until the topic comes up again a month or two later.
The Current Ratio is an LVSC
I’m not expecting LVSC to reach the cultural lexicon of financial literacy anytime soon, but LVSCC is short for Low-Value Shortcut Calculations. In my opinion, for the reasons I’ll explain below, the current ratio is an LVSC.
Many business students are taught the current ratio in school. Bankers look at this number hard, or at least they comment on the number when it drops.
My perspective is that financial statement readers accept this ratio as being one that is either important or necessary to keep an eye on without ever challenging what the metric is meant to tell us. Put n the form of a question, what is the purpose of the current ratio or what are we supposed to do with it?
I never looked at this number when I started doing financial modeling early in my career. I cared about cash flow and the causes of efficient cash flow, such as high receivables and inventory turnover. If the current ratio is supposed to give me an indicator of the financial health of the business, it cannot replace the output of a financial model, yielding whether the company being modeled is highly liquid or not. This is why I consider the current ratio an LVSC.
What Is a Healthy Current Ratio?
Recommending the ideal current ratio is difficult because that number is going to vary depending on the industry you are in and the dynamics of your cash flow cycles.
Let’s say you have a high current ratio. Is that inherently good? Not necessarily. Receivables could be too high with old, past-due balances. Inventory could also be too high as well. So a 2 to 2.5 current ratio could be misleading. And if it is misleading, why even present it anywhere in our financial reporting or organizational dashboards?
Wal-Mart’s Current Ratio
Let’s pick on Wal-Mart for a minute. Successful from a financial standpoint, right? But notice their current ratio. Over the past 10 years, it’s never pushed past 1.0.
I can tell you with confidence that the financial geeks in Bentonville are not concerned.
How is it this company hums year after year from a cash flow perspective? Think taxi cab in downtown Manhatten. Taxi cabs generate cash quick and often. And that’s exactly what happens at Wal-Mart.
The company buys inventory, and they turn that inventory into cash very quickly. They own a well-oiled cash machine.
I Much Prefer Cash Conversion Days over Current Ratio
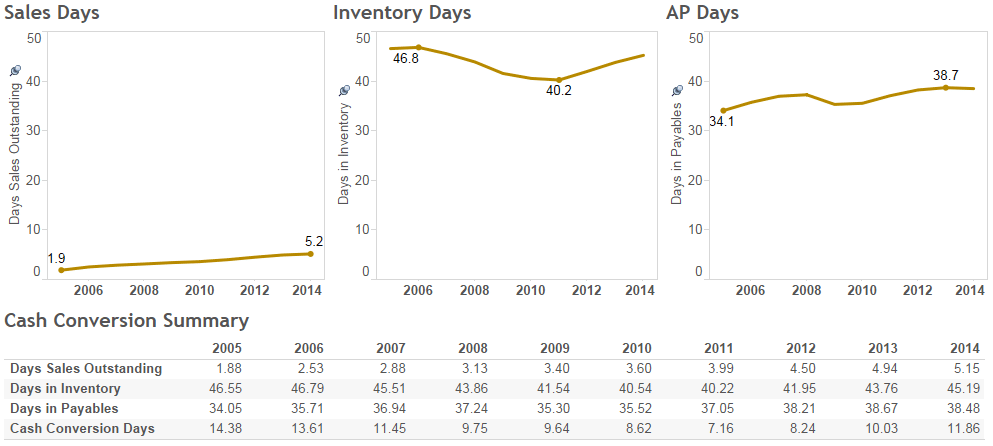
Consider what I perceive to be a much better presentation that should give the boot to the current ratio graph below.
The chart on the left plots cash conversion days over time. Notice the 10-year average is around 10.5 days. At one point, they were as low as 7.2, but that number has now steadily climbed for 3 consecutive years since the low-water mark. If this were your company, we would drill into monthly detail to see when the problem started and what caused the increase.
The smaller charts at right are what drive the bigger cash conversion metrics we just discussed.
I’m more interested in inventory because that’s the number Wal-Mart has the most control over. I’m guessing they have inventory management nailed to where it’s a science. Year to year, days in inventory rarely change.
So what’s causing cash conversion days to increase? Days sales in receivables are rising. I have not looked into this number, and I’m surprised Wal-Mart has trade receivables of any kind. But I’m sure the financial analysts at Wal-Mart know the issues driving this metric upward.
Cash Conversion Days Defined
Simply put, cash conversion days represent the approximate number of days to convert inventory to cash (using our example above). The number is not exact, just a rough approximation. But the result when compared with prior periods serves as a proxy as to whether we’re getting better or worse at managing working capital.
The computation is simple. Start with days sales in accounts receivable (if applicable) and add days in inventory. Then subtract days in accounts payable.
Below is the presentation I generally build for my clients with two exceptions. First, we have a monthly view on a trailing 13-month basis. And we have a second view on a trailing 13-week basis. But the format looks similar to the graphic below which is reflected in years (which I happened to build in Tableau in just a matter of minutes).
Nothing fancy, just a presentation I can glance at and get the big picture quickly. Personally, I tend to look at cash conversion days in the table scanning from right to left. If I see numbers jumping around, I move up the table. And that’s why we plug in the graphs so that any hiccups will pop.
On a side note, if you replicate this, make sure to keep your y-axis for all graphs the same so that the presentation remains meaningful. So in the realm of days (the y-axis), we’re comparing apples to apples by keeping the maximum number of days set to 50.
Start Implementing Your Cash Conversion Metrics Now
I believe cash conversion days present a clearer picture of what’s going on with working capital. Negative and positive trends can be spotted much easier than just monitoring a current ratio chart with trailing history.
Furthermore, tracking cash conversion days and maintaining a weekly cash flow forecast is the optimal solution for ensuring short-term cash surprises are held at bay.
Current ratio? Drop it.
Title image by Mike Mozart through Creative Commons 2.0