
I pity young financial analysts who use Excel in their first jobs. Every Excel project they maintain or complete includes multiple ways to solve a problem using that tool. For instance, I can quickly think of four effective and elegant methods to create financials in Excel when data is being pulled from a trial balance.
In this discussion, I will focus on one method or solution for Excel-based financial reporting. This solution involves using Excel’s SUMPRODUCT function. Once you start using it, you’ll never look back.
Incidentally, this discussion assumes you ARE NOT using F9 or Jet Reports, which are Excel add-ins for financial reporting. If so, I cannot think of a reason to use or need SUMPRODUCT (if I’m wrong, please let me know).
Data Preparation
I’m going to cheat. I’m starting with a clean balance sheet and income statement trial balance data. In most cases, you’ll need to extract, transform, and load (ETL) your data to Excel using a method that allows you to use Excel’s SUMPRODUCT or similar functions.
For such a discussion on ETL, search for data transformation using Power Query on YouTube, and you’ll find many tutorials. Accordingly, I’m focusing on SUMPRODUCT, so the data we’re using is already prepped to be shaped in a readable manner.
Trial Balance GL Code Preparation
Old habits die hard. Perhaps I’m the only person who does this, but I still like to separate my GL data by balance sheet, and P&L. Can both be combined? Yes, but there are nuances.
In my example, I use two sheets. Grabbing the data via SUMPRODUCT is more straightforward and has fewer steps. However, feel free to streamline the process by using one sheet.
Once my trial balance is included in my worksheets, I will add columns for:
- Report grouping categories (e.g., revenue, COGs, SG&A, and other)
- Report grouping sub-categories (e.g., compensation, facilities, operations, general and admin, marketing, interest)
- Select metadata if needed
Additionally, I confirm that I have no breaks in my column headings or rows. All data in columns and rows need to be contiguous to make Excel’s SUMPRODUCT function work.
For larger organizations, I may have three columns of categories and sub-categories. Do not be afraid to use your creativity to group your data for reporting purposes. You should already know what your report design will look like; create your data headings accordingly.
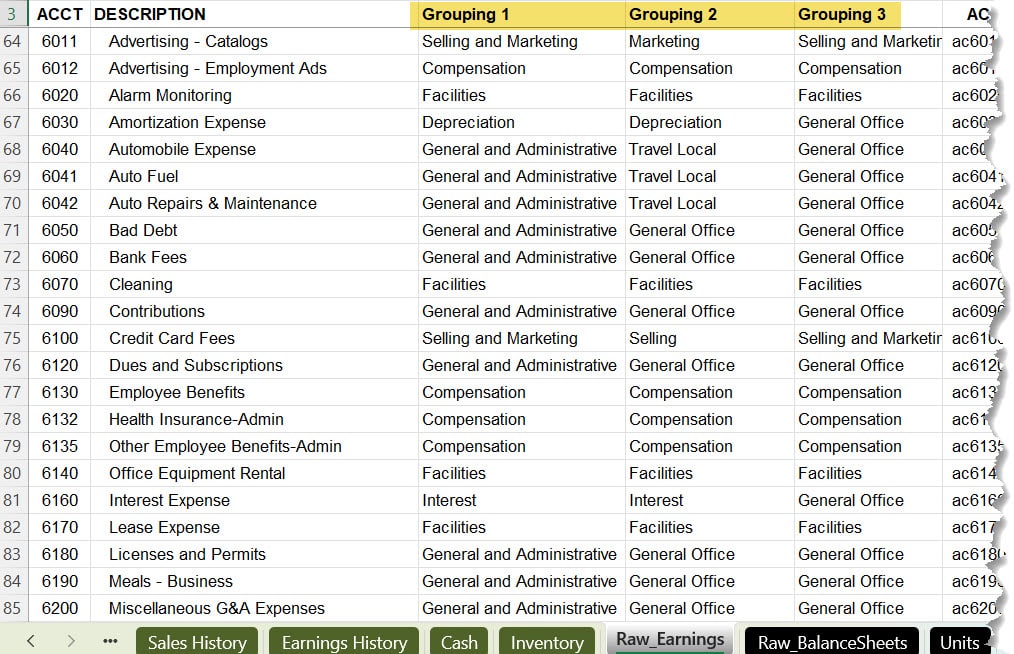
In the video later in this post, I combine the first two grouping columns into one column. I do this to simplify the use of Excel’s SUMPRODUCT function.
Report Design
Usually, this step goes first. I always think of the customer first, my financial statement reader. I also know what I want to read. I want a clear and straightforward format that allows me and my readers to understand what’s happening as quickly as possible from a financial reporting point of view.
Below is an example of how I designed the shell of the report first without any data or financial calculations (percentages). Notice I included Unit Sales as metadata, which is included in the same sheet as the income statement trial balance.
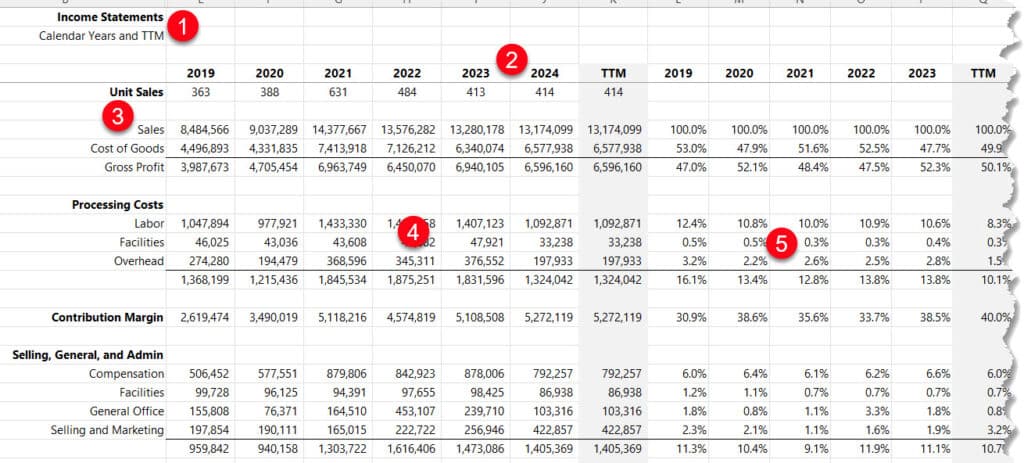
- A simple heading describing the report and time period
- Date headings (the beginning and ending date ranges are hidden)
- Row headings that represent the income statement sub-categories
- The financial data which is located in the income statement trial balance worksheet
- Common sizing calculations
Consider designing the report first, then determine the data layout requirements. Order is unnecessary, but thinking with the end in mind is useful and a neat hack.
Don’t forget to leave row space for date ranges, which can be hidden. You’ll use these cells for your first two arguments in SUMPRODUCT (included in the video below).
Excel’s SUMPRODUCT Walkthrough
Below is a simple tutorial on using Excel’s SUMPRODUCT to create a simple income statement. This is for demonstration purposes only, so the focus is not on prettiness or presentation. The focus is on the function itself.
Remember the best practices for using Excel’s SUMPRODUCT for financial reporting of any type:
- Remember to include whitespace in formulas to enhance readability
- Start with parameters first
- Finish the last argument preceded by a comma
- Go back and fix the column and row headings as needed
- Used named ranges to simplify formulas
Better Than F9 and Jet Reports
No, using Excel without the support of a third-party add-in IS NOT the optimal reporting solution. I love F9 and Jet Reports. Use them if you can.
But what if you can’t access those tools and use QuickBooks for your accounting solution? While there are some nuanced tools to pull data from Excel, including F9, in a matter of seconds, trial balance data can be downloaded into spreadsheets monthly and cleansed as needed.
You’ve seen how SUMPRODUCT can quickly summarize data and mimic what F9 and Jet Reports do. SUMPRODUCT is not better than F9 or Jet Reports, but you’ll never stop once you start using it.