Many years ago, I was playing the role of retail sabermetrician, and I was frustrated because I could not better understand my client’s top line. At the time, we were growing by leaps and bounds, both organically and through strategic acquisitions.
Sure, same-store-sales analysis is typically the go-to metric in retail, but I needed a better way of determining the overall impact on the P&L through this hyper-growth. Comparing year-over-year financials was not helpful, nor could I easily grasp the trends in our capital structure over time.
Accordingly, I started generating full 12-month profit and loss statements and comparing them to the same 12-month period a year earlier, regardless of the month. I also conducted a similar analysis for our rapidly changing capital structure, looking for potential problems this growth could lead to.
Since then, I can quickly tell you where a company is and where it’s headed by viewing a few pictures of the top line. I can probably also tell you about the owner’s personality and the strength of the team.
Let’s Start with Trailing 12-Month Sales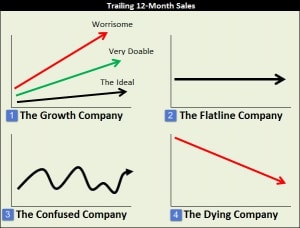
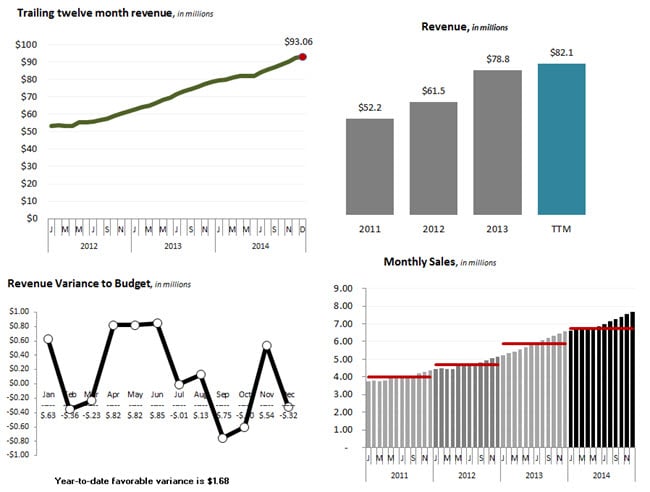
When I start working with a new company, I first want to see the prior 72 months of sales. I can quickly plot the numbers in a few seconds to gain insights. I built these graphs so that each point on the chart line equals sales for the current plus the previous eleven months.
One can plot the same data using trailing-three-month sales or some other period. I prefer using 12 months because most clients have some seasonality in their calendar years.
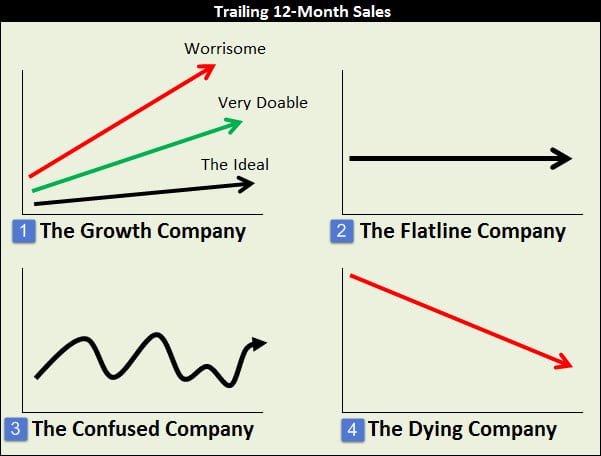
The result is either a growing line, a flat line, an erratic line, or a sloping downward line.
There’s only one way to move these lines, and that’s through strategy. It can be a good strategy, a poor strategy, or just doing nothing.
So let’s look at each of these four lines.
The Growth Company: Growth can be slow and steady or bumpy and tumultuous. I generally like somewhere in between. Expect to see hyper-growth in young start-ups. That’s the norm, or it should be.
The critical factor I want to know is whether the management team can truly support growth. A strong team is vital. But be prepared to swap out team members if the growth curves continue. Rarely can the same team managing a $10 million company possess the abilities in a $30 million growing company.
The other concern I have for these hyper-growth companies is their profitability. Operational excellence typically takes a back seat to strategic growth. So the capital structure needs to be adequate to support this growth.
Double-digit growth as high as 20 percent annually can still lead to profitable results. I’ve seen this in online or SaaS-based ventures because staff increases generally do not occur until a specific customer count is hit. When that next round of hiring occurs, the existing business can easily absorb the short-term spike in labor costs.
The goal of all these growth scenarios is to understand your customer acquisition cost in big gulps. For example, for every $1 to $5 million increase in revenue, you should generally know the requirements for new fixed-cost spending.
The Flatline Company: These may seem like dull businesses at first blush. Perhaps they are, but I have no problems with such entities.
But questions need to be asked. Are the owners committed to excellence in this organization? Are employees engaged? Is competition continually scoped? What threats could move our flatline downward?
In reality, the flatline company cannot be a flatliner forever. Costs go up. And revenues need to as well. However, if this historical trend continues, cost containment will be critical. There can be little room for error. Banking relationships need to be solid.
The Confused Company: I rarely encounter these businesses, but this pattern is not unusual in highly cyclical industries. I saw spikes in construction up to 2001, then a slow rebirth after 2004, and then back down in late 2008 and early 2009. Now the curve is moving upward for the specialty contractors I serve.
Confused? Maybe that’s an unfair word for these types of businesses. The key for these businesses is not to overspend during times of plenty and build up cash reserves when business spikes. Keeping the core group of employees is difficult, but if cash reserves exist during the troughs, at least the best of the best can be retained.
While the growth curve of the confused company looks erratic over time, I’ve seen a few such curves with smaller jumps and drops when coaching small business owners who cannot make up their minds about what they want to be when they grow up. This occurs when they cannot settle on one set strategy. These business owners have a difficult time with laser-like focus, hence the bumpy growth curve.
The Dying Company: I hate these curves and can say that with first-hand experience. When I see these curves, the first question is, “How long till we pull the plug?” Would you believe most owners think there is still hope in these situations?
Knowing when to say “when” may be the most difficult decision a business owner ever makes—even more difficult than firing an employee or letting a long-time client go. I don’t see it that way. I see the decision as saying “yes” to something else, a better opportunity.
There’s a reason we have turnaround experts available for these businesses. The best of these advisers know how to turn around a dying organization. Turnarounds can generally occur when poor management is the primary cause of poor performance. Fixing a dying customer base is a different story and hard to overcome.
Let’s Compare Sales to Plan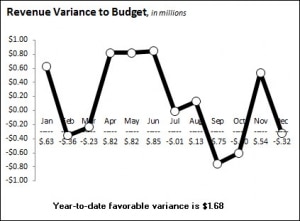
My best clients carefully plan their sales for the upcoming year, each October or November. That’s not to say adjustments won’t be made along the way.
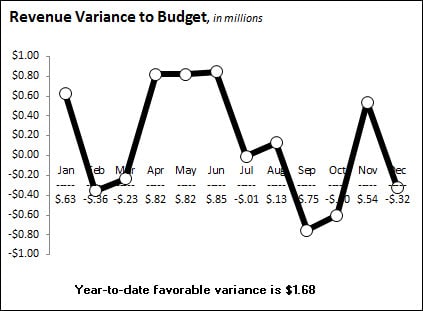
So I like to build a simple picture showing me 1) how often the sales team exceeds plan, and 2) what the year-to-date results are.
In short, I can tell a lot about a business when it does precisely what it planned on doing.
Missing a budget for two or three months is not necessarily bad. The question becomes, “Why?”
In short, and as a rule, I want to see a business beating its budget more than half the time out of the year. The goal is for those positive months to more than offset the months the company misses budget.
Understanding Seasonality Is Helpful
This snapshot is marginally helpful, but additional insight is valuable when adding the average monthly sales for each year listed.
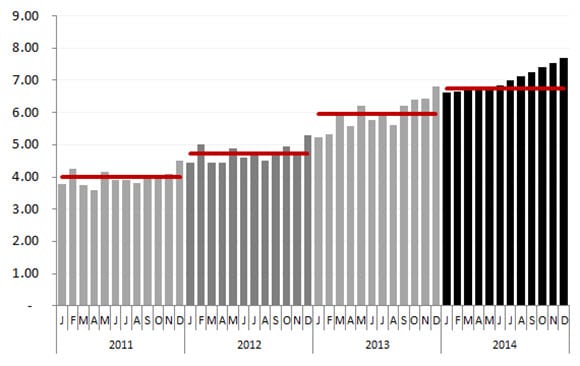
A glance at this Tableau-generated graph reveals jumps in revenue each year, although it’s hard to ascertain just looking at the monthly data points.
Looking at Year-Over-Year Sales
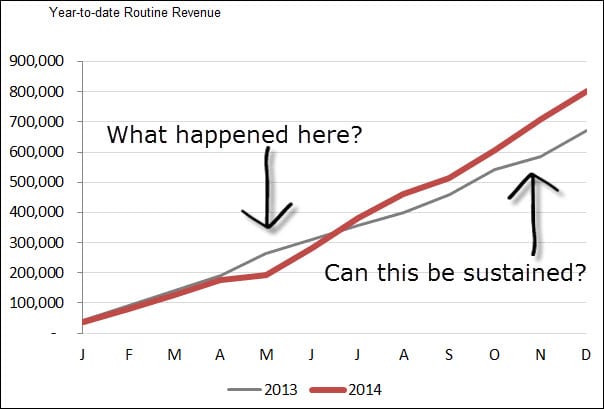
Like the trailing 12-month analysis mentioned above, I like comparing year-over-year numbers in three, six, nine, and 12-month periods. Again, I’m looking for trends. While not shown here, I present the data in a table format.
This analysis is insightful. Year-to-date numbers compared to the prior year may appear favorable, but when you start breaking down the time increments with varying time periods, the results may tell a different story. Of course, this will appear in some of the other visuals mentioned earlier.
Never Overlook Customer Sales
Now we must step away from the visuals for a minute and focus on raw data (although heat maps provide some residual value).
I was recently working on acquiring a small engineering and consulting firm and was interested in the seller’s client base. First, I ranked his customer sales for the previous year as such:
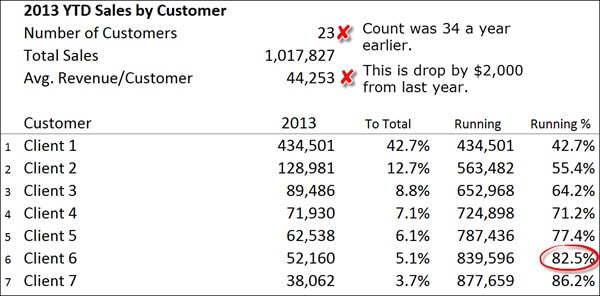
Notice his top clients represent the majority of his revenues. My client and I were especially concerned about the longevity of client numbers 2 and 3.
Additionally, we quickly found that the average sales by customer had dropped along with his client count. This was extremely helpful in developing a purchase price for this firm, which we heavily discounted.
Then, I looked at sales year-over-year, looking for drops as shown below:
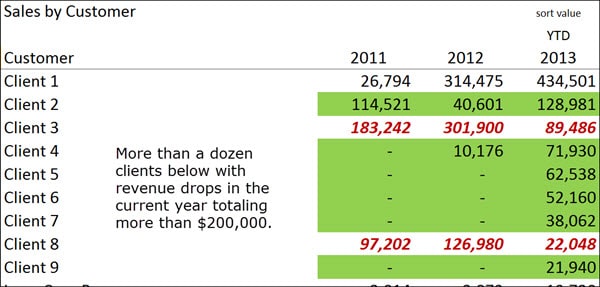
The analysis above is necessary for non-retail businesses and should be part of the monthly sales analysis. The analysis can be by line of business, product line, or any other way sales can be easily segmented.
Final Thoughts
I wish I had a dollar for every sales report a client has handed me in the past. Typically, that sales report is nothing more than the P&L showing this year’s sales compared to a year earlier.
Sales analysis is not complex. The information above should only take 15 to 20 minutes to compile every month. Remember, we could have drilled down deeper using visual analytical tools like Tableau, but that’s a topic for another day.
The objective is not to repeat the above exactly in your organization. Sales analysis starts with a fundamental question: “What happened and why?” Then, use a proper tool set to dictate how you want to structure your analysis to provide insight into your top line.
I hope you will excuse me; I must analyze the following company for an upcoming meeting.